Traffic Analysis for ether9-Enlace-Silipica -- MT-Simbol
| System: | MT-Simbol in Simbol |
| Maintainer: | conexis |
| Description: | ether9-Enlace-Silipica |
| ifType: | ethernetCsmacd (6) |
| ifName: | ether9-Enlace-Silipica |
| Max Speed: | 1000.0 Mbits/s |
| Ip: | 172.16.60.97 (No DNS name) |
The statistics were last updated Wednesday, 14 October 2026 at 3:05,
at which time 'MT-Simbol' had been up for 5 days, 17:17:56.
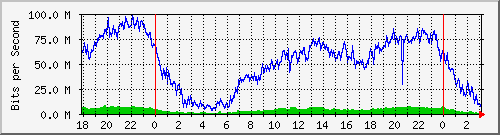
`Daily' Graph (5 Minute Average)
|
Max |
Average |
Current |
| In |
12.1 Mb/s (0.1%) |
4237.9 kb/s (0.0%) |
1241.5 kb/s (0.0%) |
| Out |
128.6 Mb/s (1.3%) |
67.8 Mb/s (0.7%) |
18.7 Mb/s (0.2%) |
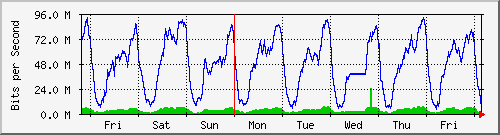
`Weekly' Graph (30 Minute Average)
|
Max |
Average |
Current |
| In |
10.6 Mb/s (0.1%) |
4179.0 kb/s (0.0%) |
2057.0 kb/s (0.0%) |
| Out |
120.8 Mb/s (1.2%) |
61.2 Mb/s (0.6%) |
27.0 Mb/s (0.3%) |
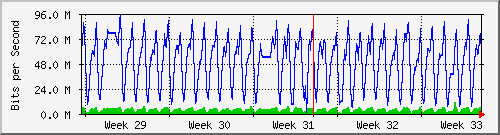
`Monthly' Graph (2 Hour Average)
|
Max |
Average |
Current |
| In |
7822.0 kb/s (0.1%) |
4075.4 kb/s (0.0%) |
4748.7 kb/s (0.0%) |
| Out |
111.4 Mb/s (1.1%) |
55.6 Mb/s (0.6%) |
74.0 Mb/s (0.7%) |
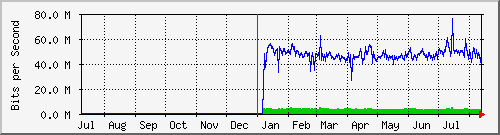
`Yearly' Graph (1 Day Average)
|
Max |
Average |
Current |
| In |
5363.3 kb/s (0.1%) |
3828.0 kb/s (0.0%) |
3984.4 kb/s (0.0%) |
| Out |
75.9 Mb/s (0.8%) |
48.3 Mb/s (0.5%) |
61.6 Mb/s (0.6%) |
| GREEN ### |
Incoming Traffic in Bits per Second |
| BLUE ### |
Outgoing Traffic in Bits per Second |


